The Science of Sound
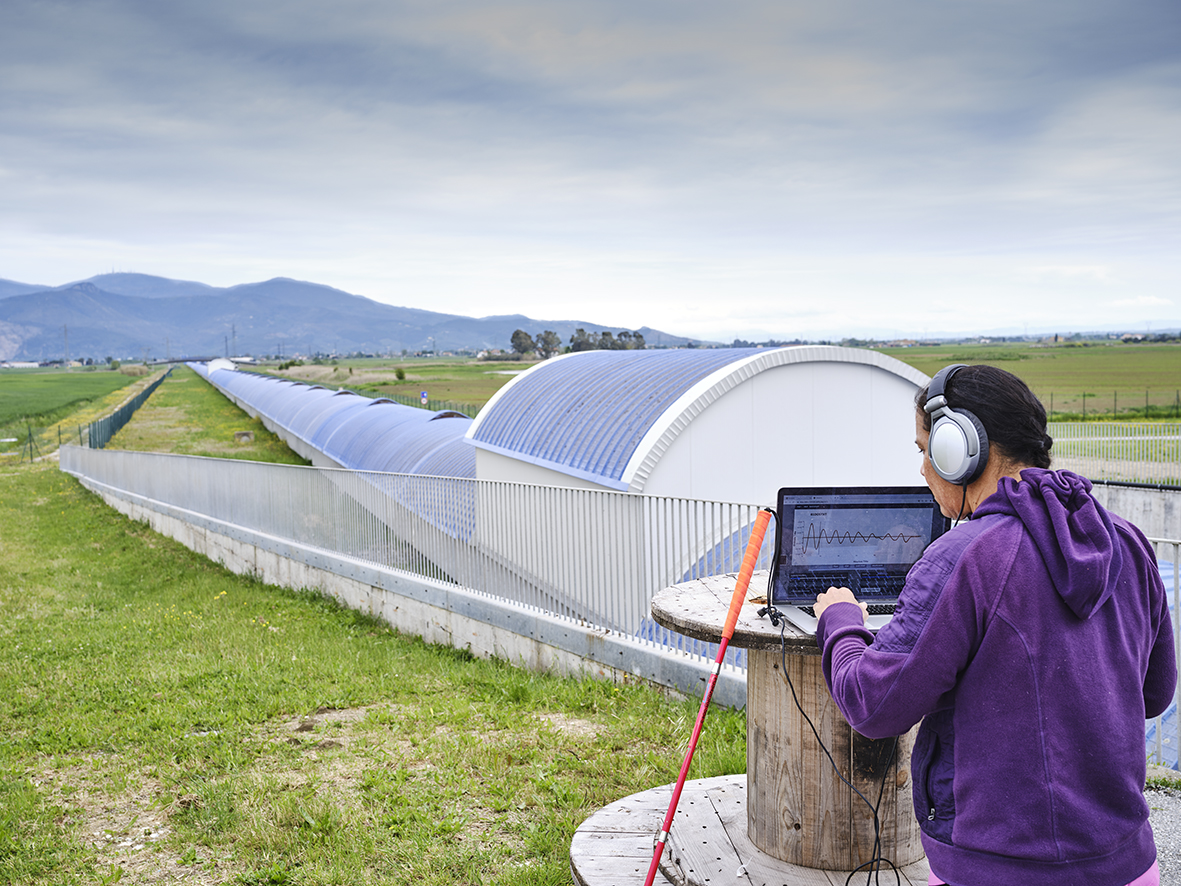
It’s common to think of scientific data as something that gets represented through graphs and other visual means, but that’s not the only possibility, nor should it be. Space science endeavors, require for space scientists to display and perceive with precision, handle and explore measurements containing more information than can be conveniently displayed at one time on a single screen under the pressure of constantly changing task demands. This issue leads to pervasive uncertainty during data analysis. At the European gravitational observatory (EGO) researchers are retaking the long existing but almost forgotten option of using sound to explore the measurements gathered by telescopes. In this way EGO is retaking this method that was already in use at the end of the 1800’s.
You may remember the telegraph which led to great advances in telecommunications, mostly the transfer of a real voice signal from point `a’ to point `b’ in real time. Those advances and the research on static and interference for better communication lead to great scientific discoveries through audio perception. Moreover the use of multi sensorial perception for data analysis has been documented in space sciences back to 1894 and 1919 who used audio sensory modalities to study “atmospheric impulses” which as described in their papers “produces a faintly musical or chirping sound called tweeks”.
Moreover, “Visualization” of astronomical measurements do have shortcomings. Due to the limitations of the human eye and of spatial resolution, the standard methods available to visually display astronomical measurements reduce the amount of information that can be displayed and interpreted. This in turn may lead to discoveries being missed,. Another situation is that methods currently used to perform the tasks that are natural of the astronomy field make astronomy inaccessible to peoples that are not visually oriented.

Wanda Diaz Merced is an astronomer at EGO leading a program the development of other possibilities of data representation, especially sonification, the display of data through sound. The next page contain links to download sound-visual repetition training and a training based on error. Some of the experiments/training use audio only, others audio and visual display, others audio and visual display with a redline sweeping across the display. Visit the page and engage with a first version of a training prepared by Prof. Merced: https://ep.ego-gw.eu/SonificationTraining/HomePage.html
If you are interested on participating on our search to convert astronomy measurements into a more interpretable form using other sensorial modalities ( for example audio but we do not discard others), develop effective ways to use (perceptually) sound to augment signatures (e.g, fleeting changes, quasiperiodic, non-persistent) in the data, and develop greater capabilities for rendering these data get in touch with us by writing to c.hettlage@saao.nrf.ac.za
